Sergio Cipriano: Zero-Code Instrumentation of an Envoy TCP Proxy using eBPF

Zero-Code
Instrumentation of an Envoy TCP Proxy using eBPF
I recently had to debug an Envoy
Network Load Balancer, and the options Envoy provides just weren’t
enough. We were seeing a small number of HTTP 499 errors caused by
latency somewhere in our cloud, but
it wasn’t clear what the bottleneck was. As a result, each team had to
set up additional instrumentation to catch latency spikes and figure out
what was going on.
My team is responsible for the LBaaS product (Load Balancer as a
Service) and, of course, we are the first suspects when this kind of
problem appear.
Before going for the current solution, I read a lot of Envoy’s
documentation.
It is possible to enable access
logs for Envoy, but they don’t provide the information required for
this debug. This is an example of the output:
[2025-12-08T20:44:49.918Z] "- - -" 0 - 78 223 1 - "-" "-" "-" "-" "172.18.0.2:8080"I won’t go into detail about the line above, since it’s not possible
to trace the request using access logs alone.
Envoy also has OpenTelemetry
tracing, which is perfect for understanding sources of latency.
Unfortunatly, it is only available for Application Load Balancers.
Most of the HTTP 499 were happening every 10 minutes, so we managed
to get some of the requests with tcpdump, Wireshark and using http headers
to filter the requests.
This approach helped us reproduce and track down the problem, but it
wasn’t a great solution. We clearly needed better tools to catch this
kind of issue the next time it happened.
Therefore, I decided to try out OpenTelemetry
eBPF Instrumentation, also referred to as OBI.
I saw the announcement of Grafana Beyla before it was renamed to OBI,
but I didn’t have the time or a strong reason to try it out until now.
Even then, I really liked the idea, and the possibility of using eBPF to
solve this instrumentation problem had been in the back of my mind.
OBI promises zero-code automatic instrumentation for Linux services
using eBPF, so I put together a minimal setup to see how well it
works.
Reproducible setup
I used the following tools:
Setting up a TCP Proxy with Envoy was straightforward:
static_resources:
  listeners:
  - name: go_server_listener
    address:
      socket_address:
        address: 0.0.0.0
        port_value: 8000
    filter_chains:
    - filters:
      - name: envoy.filters.network.tcp_proxy
        typed_config:
          "@type": type.googleapis.com/envoy.extensions.filters.network.tcp_proxy.v3.TcpProxy
          stat_prefix: go_server_tcp
          cluster: go_server_cluster
  clusters:
  - name: go_server_cluster
    connect_timeout: 1s
    type: LOGICAL_DNS
    load_assignment:
      cluster_name: go_server_cluster
      endpoints:
      - lb_endpoints:
        - endpoint:
            address:
              socket_address:
                address: target-backend
                port_value: 8080
This is the simplest Envoy TCP proxy configuration: a listener on
port 8000 forwarding traffic to a backend running on port 8080.
For the backend, I used a basic Go HTTP server:
package main

import (
    "fmt"
    "net/http"
)

func main() {
    http.Handle("/", http.FileServer(http.Dir(".")))

    server := http.Server{Addr: ":8080"}

    fmt.Println("Starting server on :8080")
    panic(server.ListenAndServe())
}
Finally, I wrapped everything together with Docker Compose:
services:
  autoinstrumenter:
    image: otel/ebpf-instrument:main
    pid: "service:envoy"
    privileged: true
    environment:
      OTEL_EBPF_TRACE_PRINTER: text
      OTEL_EBPF_OPEN_PORT: 8000

  envoy:
    image: envoyproxy/envoy:v1.33-latest
    ports:
      - 8000:8000
    volumes:
      - ./envoy.yaml:/etc/envoy/envoy.yaml
    depends_on:
      - target-backend

  target-backend:
    image: golang:1.22-alpine
    command: go run /app/backend.go
    volumes:
      - ./backend.go:/app/backend.go:ro
    expose:
      - 8080
OBI should output traces to the standard output similar to this when
a HTTP request is made to Envoy:
2025-12-08 20:44:49.12884449 (305.572µs[305.572µs]) HTTPClient 200 GET /(/) [172.18.0.3 as envoy:36832]->[172.18.0.2 as localhost:8080] contentLen:78B responseLen:0B svc=[envoy generic] traceparent=[00-529458a2be271956134872668dc5ee47-6dba451ec8935e3e[06c7f817e6a5dae2]-01]
2025-12-08 20:44:49.12884449 (1.260901ms[366.65µs]) HTTP 200 GET /(/) [172.18.0.1 as 172.18.0.1:36282]->[172.18.0.3 as envoy:8000] contentLen:78B responseLen:223B svc=[envoy generic] traceparent=[00-529458a2be271956134872668dc5ee47-06c7f817e6a5dae2[0000000000000000]-01]
This is exactly what we needed, with zero-code. The above trace
shows:
2025-12-08 20:44:49.12884449: time of the trace.(1.260901ms[366.65µs]): total response time for the
request, with the actual internal execution time of the request (not
counting the request enqueuing time).HTTP 200 GET /: protocol, response code, HTTP method,
and URL path.[172.18.0.1 as 172.18.0.1:36282]->[172.18.0.3 as envoy:8000]:
source and destination host:port. The initial request originates from my
machine through the gateway (172.18.0.1), hits the Envoy (172.23.0.3),
the proxy then forwards it to the backend application (172.23.0.2).contentLen:78B: HTTP Content-Length. I used curl and
the default request size for it is 78B.responseLen:223B: Size of the response body.svc=[envoy generic]: traced service.traceparent: ids to trace the parent request. We can
see that the Envoy makes a request to the target and this request has
the other one as parent.
Let’s add one more Envoy to show that it’s also possible to track
multiple services.
  envoy1:
    image: envoyproxy/envoy:v1.33-latest
    ports:
      - 9000:9000
    volumes:
      - ./envoy1.yaml:/etc/envoy/envoy.yaml
    depends_on:
      - envoy
The new Envoy will listen on port 9000 and forward the request to the
other Envoy listening on port 8000. Now we just need to change OBI open
port variable to look at a range:
And change the pid field of the autoinstrumenter service to use the
host’s PID namespace inside the container:
This is the output I got after one curl:
2025-12-09 12:28:05.12912285 (2.202041ms[1.524713ms]) HTTP 200 GET /(/) [172.19.0.1 as 172.19.0.1:59030]->[172.19.0.5 as envoy:9000] contentLen:78B responseLen:223B svc=[envoy generic] traceparent=[00-69977bee0c2964b8fe53cdd16f8a9d19-856c9f700e73bf0d[0000000000000000]-01]
2025-12-09 12:28:05.12912285 (1.389336ms[1.389336ms]) HTTPClient 200 GET /(/) [172.19.0.5 as envoy:59806]->[172.19.0.4 as localhost:8000] contentLen:78B responseLen:0B svc=[envoy generic] traceparent=[00-69977bee0c2964b8fe53cdd16f8a9d19-caa7f1ad1c68fa77[856c9f700e73bf0d]-01]
2025-12-09 12:28:05.12912285 (1.5431ms[848.574µs]) HTTP 200 GET /(/) [172.19.0.5 as 172.19.0.5:59806]->[172.19.0.4 as envoy:8000] contentLen:78B responseLen:223B svc=[envoy generic] traceparent=[00-69977bee0c2964b8fe53cdd16f8a9d19-cbca9d64d3d26b40[caa7f1ad1c68fa77]-01]
2025-12-09 12:28:05.12912285 (690.217µs[690.217µs]) HTTPClient 200 GET /(/) [172.19.0.4 as envoy:34256]->[172.19.0.3 as localhost:8080] contentLen:78B responseLen:0B svc=[envoy generic] traceparent=[00-69977bee0c2964b8fe53cdd16f8a9d19-5502f7760ed77b5b[cbca9d64d3d26b40]-01]
2025-12-09 12:28:05.12912285 (267.9µs[238.737µs]) HTTP 200 GET /(/) [172.19.0.4 as 172.19.0.4:34256]->[172.19.0.3 as backend:8080] contentLen:0B responseLen:0B svc=[backend go] traceparent=[00-69977bee0c2964b8fe53cdd16f8a9d19-ac05c7ebe26f2530[5502f7760ed77b5b]-01]
Each log line represents a span belonging to the same trace
(69977bee0c2964b8fe53cdd16f8a9d19). For readability, I
ordered the spans by their traceparent relationship, showing the
request’s path as it moves through the system: from the client-facing
Envoy, through the internal Envoy hop, and finally to the Go backend.
You can see both server-side (HTTP) and client-side (HTTPClient) spans
at each hop, along with per-span latency, source and destination
addresses, and response sizes, making it easy to pinpoint where time is
spent along the request chain.
The log lines are helpful, but we need better ways to visualize the
traces and the metrics generated by OBI. I’ll share another setup that
more closely reflects what we actually use.
Production setup
I’ll be using the following tools this time:
The goal of this setup is to mirror an environment similar to what I
used in production. This time, I’ve omitted the load balancer and
shifted the emphasis to observability instead.
I will run three HTTP servers on port 8080: two inside Incus
containers and one on the host machine. The OBI process will export
metrics and traces to an OpenTelemetry Collector, which will forward
traces to Jaeger and expose a metrics endpoint for Prometheus to scrape.
Grafana will also be added to visualize the collected metrics using
dashboards.
The aim of this approach is to instrument only one of the HTTP
servers while ignoring the others. This simulates an environment with
hundreds of Incus containers, where the objective is to debug a single
container without being overwhelmed by excessive and irrelevant
telemetry data from the rest of the system.
OBI can filter metrics and traces based on attribute values, but I
was not able to filter by process PID. This is where the OBI Collector
comes into play, it allows me to use a processor to filter telemetry
data by the PID of the process being instrumented.
These are the steps to reproduce this setup:
- Create the incus containers.
$ incus launch images:debian/trixie server01
Launching server01
$ incus launch images:debian/trixie server02
Launching server02- Start the HTTP server on each container.
$ apt install python3 --update -y
$ tee /etc/systemd/system/server.service > /dev/null <<'EOF'
[Unit]
Description=Python HTTP server
After=network.target

[Service]
User=root
Group=root
Type=simple
ExecStart=/usr/bin/python3 -m http.server 8080
Restart=always
StandardOutput=journal
StandardError=journal

[Install]
WantedBy=multi-user.target
EOF
$ systemctl start server.service- Start the HTTP server on the host.
$ python3 -m http.server 8080- Start the Docker compose.
services:
  autoinstrumenter:
    image: otel/ebpf-instrument:main
    pid: host
    privileged: true
    environment:
      OTEL_EBPF_CONFIG_PATH: /etc/obi/obi.yml
    volumes:
      - ./obi.yml:/etc/obi/obi.yml

  otel-collector:
    image: otel/opentelemetry-collector-contrib:0.98.0
    command: ["--config=/etc/otel-collector-config.yml"]
    volumes:
      - ./otel-collector-config.yml:/etc/otel-collector-config.yml
    ports:
      - "4318:4318" # Otel Receiver
      - "8889:8889" # Prometheus Scrape
    depends_on:
      - autoinstrumenter
      - jaeger
      - prometheus

  prometheus:
    image: prom/prometheus
    volumes:
      - ./prometheus.yml:/etc/prometheus/prometheus.yml
    ports:
      - "9090:9090" # Prometheus UI

  grafana:
    image: grafana/grafana
    restart: always
    environment:
      - GF_SECURITY_ADMIN_USER=admin
      - GF_SECURITY_ADMIN_PASSWORD=RandomString123!
    volumes:
      - ./grafana-ds.yml:/etc/grafana/provisioning/datasources/datasource.yml
    ports:
      - "3000:3000" # Grafana UI

  jaeger:
    image: jaegertracing/all-in-one
    container_name: jaeger
    ports:
      - "16686:16686" # Jaeger UI
      - "4317:4317"  # Jaeger OTLP/gRPC Collector
Here’s what the configuration files look like:
- obi.yml:
log_level: INFO
trace_printer: text

discovery:
  instrument:
    - open_ports: 8080

otel_metrics_export:
  endpoint: http://otel-collector:4318
otel_traces_export:
endpoint: http://otel-collector:4318- prometheus.yml:
global:
  scrape_interval: 5s

scrape_configs:
  - job_name: 'otel-collector'
    static_configs:
- targets: ['otel-collector:8889']- grafana-ds.yml:
apiVersion: 1

datasources:
  - name: Prometheus
    type: prometheus
    access: proxy
    url: http://prometheus:9090
isDefault: true- otel-collector-config.yml:
receivers:
  otlp:
    protocols:
      http:
        endpoint: otel-collector:4318

exporters:
  otlp/jaeger:
    endpoint: jaeger:4317
    tls:
      insecure: true

  prometheus:
    endpoint: 0.0.0.0:8889
    namespace: default

service:
  pipelines:
    traces:
      receivers: [otlp]
      exporters: [otlp/jaeger]

    metrics:
      receivers: [otlp]
      exporters: [prometheus]
We’re almost there, the OpenTelemetry Collector is just missing a
processor. To create the processor filter, we can look at the OBI logs
to find the PID of the HTTP server being instrumented:
autoinstrumenter-1  | time=2025-12-30T19:57:17.593Z level=INFO msg="instrumenting process" component=discover.traceAttacher cmd=/usr/bin/python3.13 pid=297514 ino=460310 type=python service=""
autoinstrumenter-1  | time=2025-12-30T19:57:18.320Z level=INFO msg="instrumenting process" component=discover.traceAttacher cmd=/usr/bin/python3.13 pid=310288 ino=722998 type=python service=""
autoinstrumenter-1  | time=2025-12-30T19:57:18.512Z level=INFO msg="instrumenting process" component=discover.traceAttacher cmd=/usr/bin/python3.13 pid=315183 ino=2888480 type=python service=""
Which can also be obtained using standard GNU/Linux utilities:
$ cat /sys/fs/cgroup/lxc.payload.server01/system.slice/server.service/cgroup.procs
297514
$ cat /sys/fs/cgroup/lxc.payload.server02/system.slice/server.service/cgroup.procs
310288
$ ps -aux | grep http.server
USER         PID %CPU %MEM    VSZ   RSS TTY      STAT START   TIME COMMAND
1000000   297514  0.0  0.1  32120 14856 ?        Ss   16:03   0:00 /usr/bin/python3 -m http.server 8080
1000000   310288  0.0  0.1  32120 10616 ?        Ss   16:09   0:00 /usr/bin/python3 -m http.server 8080
cipriano  315183  0.0  0.1 103476 11480 pts/3    S+   16:17   0:00 python -m http.server 8080
If we search for the PID in the OpenTelemetry Collector endpoint
where Prometheus metrics are exposed, we can find the attribute values
to filter on.
$ curl http://localhost:8889/metrics | rg 297514
default_target_info{host_id="148f400ad3ea",host_name="148f400ad3ea",instance="148f400ad3ea:297514",job="python3.13",os_type="linux",service_instance_id="148f400ad3ea:297514",service_name="python3.13",telemetry_sdk_language="python",telemetry_sdk_name="opentelemetry-ebpf-instrumentation",telemetry_sdk_version="main"} 1
Now we just need to add the processor to the collector
configuration:
processors: # <--- NEW BLOCK
filter/host_id:
traces:
span:
- 'resource.attributes["service.instance.id"] == "148f400ad3ea:297514"'
service:
pipelines:
traces:
receivers: [otlp]
processors: [filter/host_id] # <--- NEW LINE
exporters: [otlp/jaeger]
metrics:
receivers: [otlp]
processors: # <--- NEW BLOCK
- filter/host_id
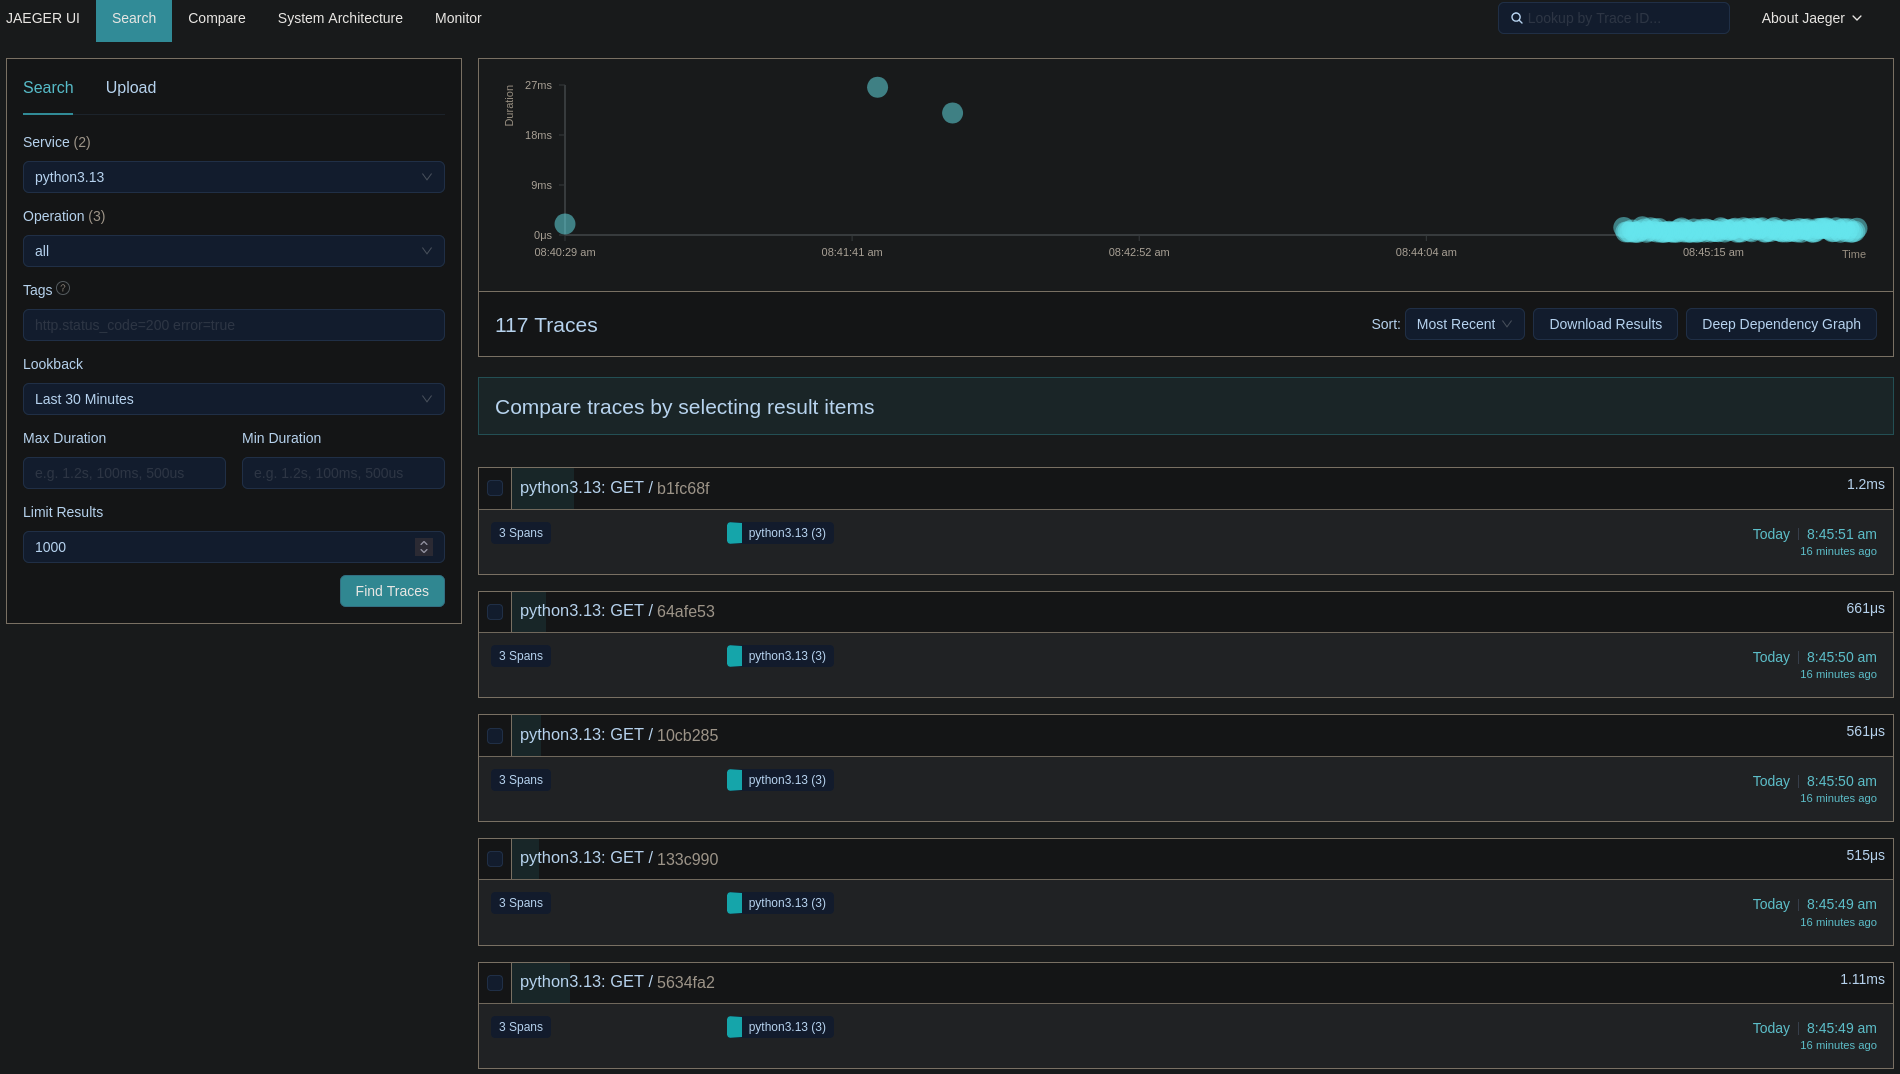
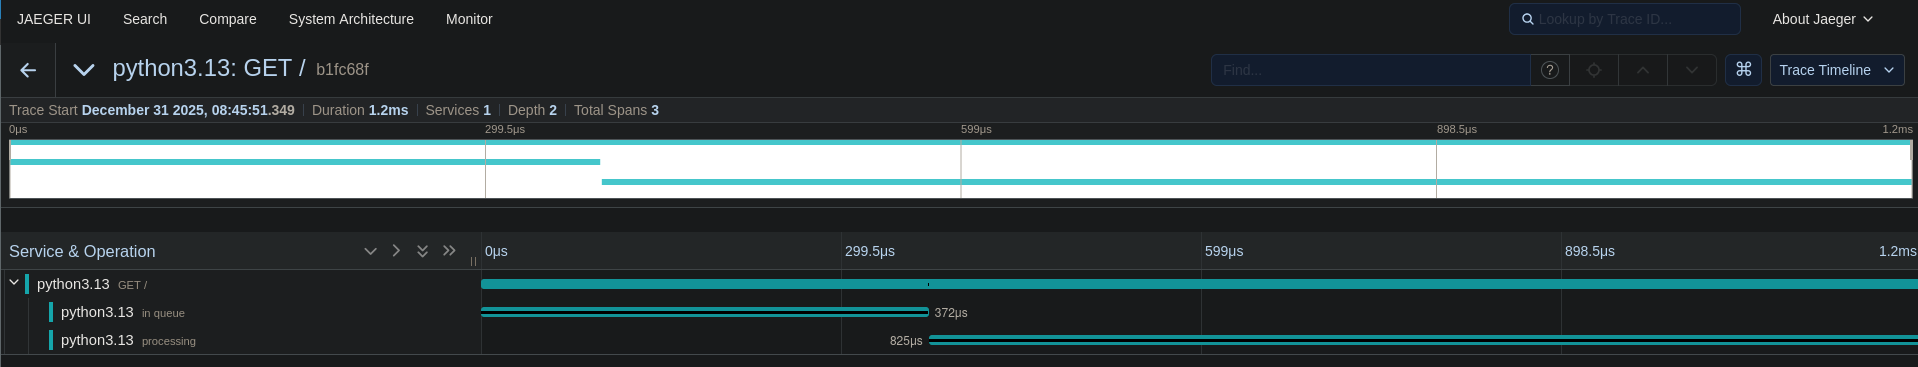
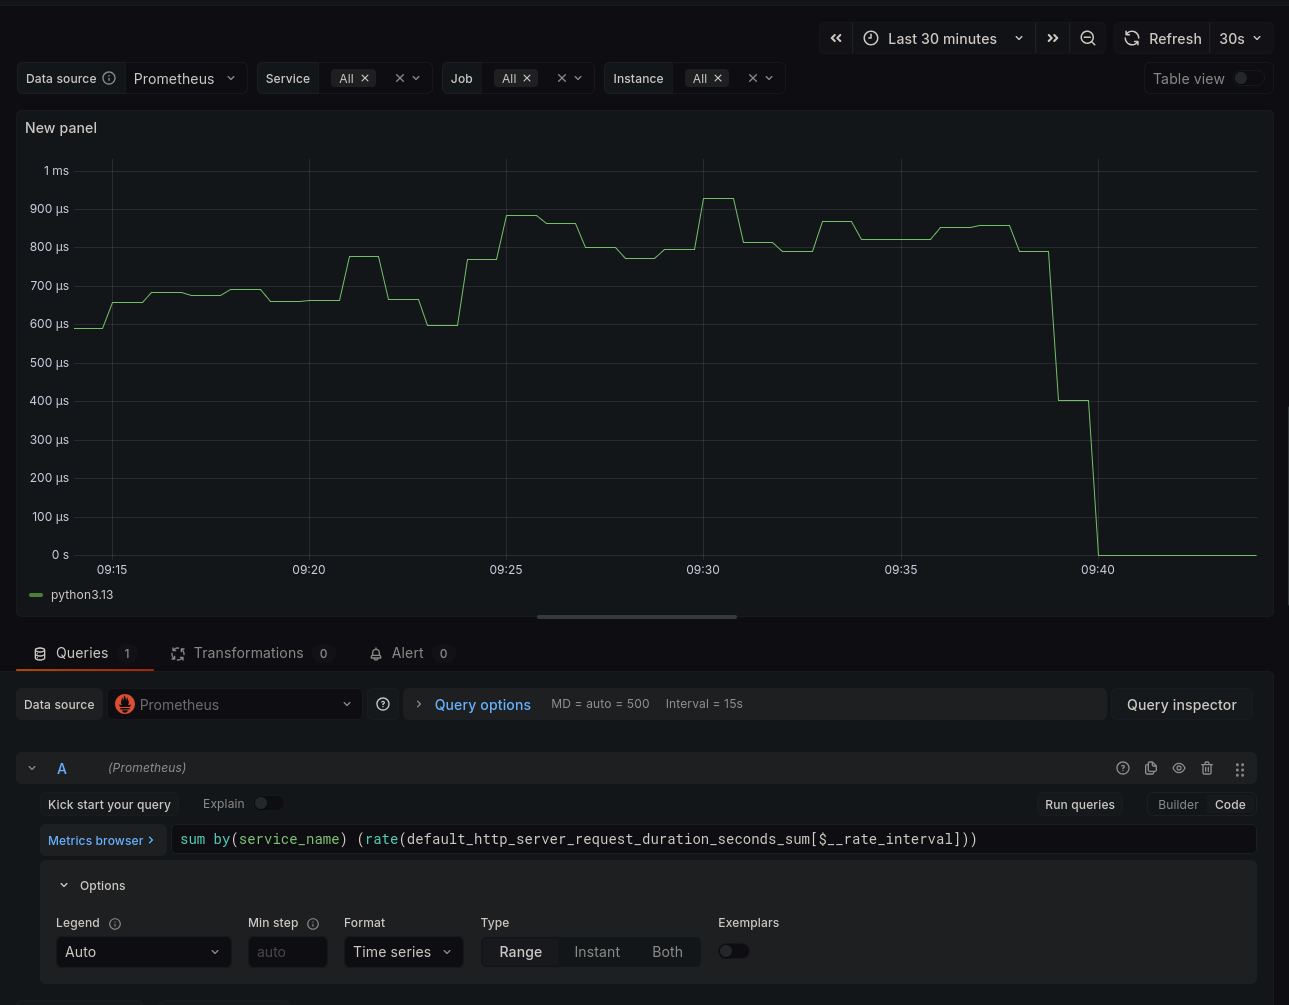
exporters: [prometheus]That’s it! The processor will handle the filtering for us, and we’ll
only see traces and metrics from the HTTP server running in the
server01 container. Below are some screenshots from Jaeger
and Grafana:
Closing Notes
I am still amazed at how powerful OBI can be.
For those curious about the debug, we found out that a service
responsible for the network orchestration of the Envoy containers was
running netplan apply every 10 minutes because of a bug.
Netplan apply causes interfaces to go down temporarily and this made the
latency go above 500ms which caused the 499s.